Greenland: From Lidar to Ice Change
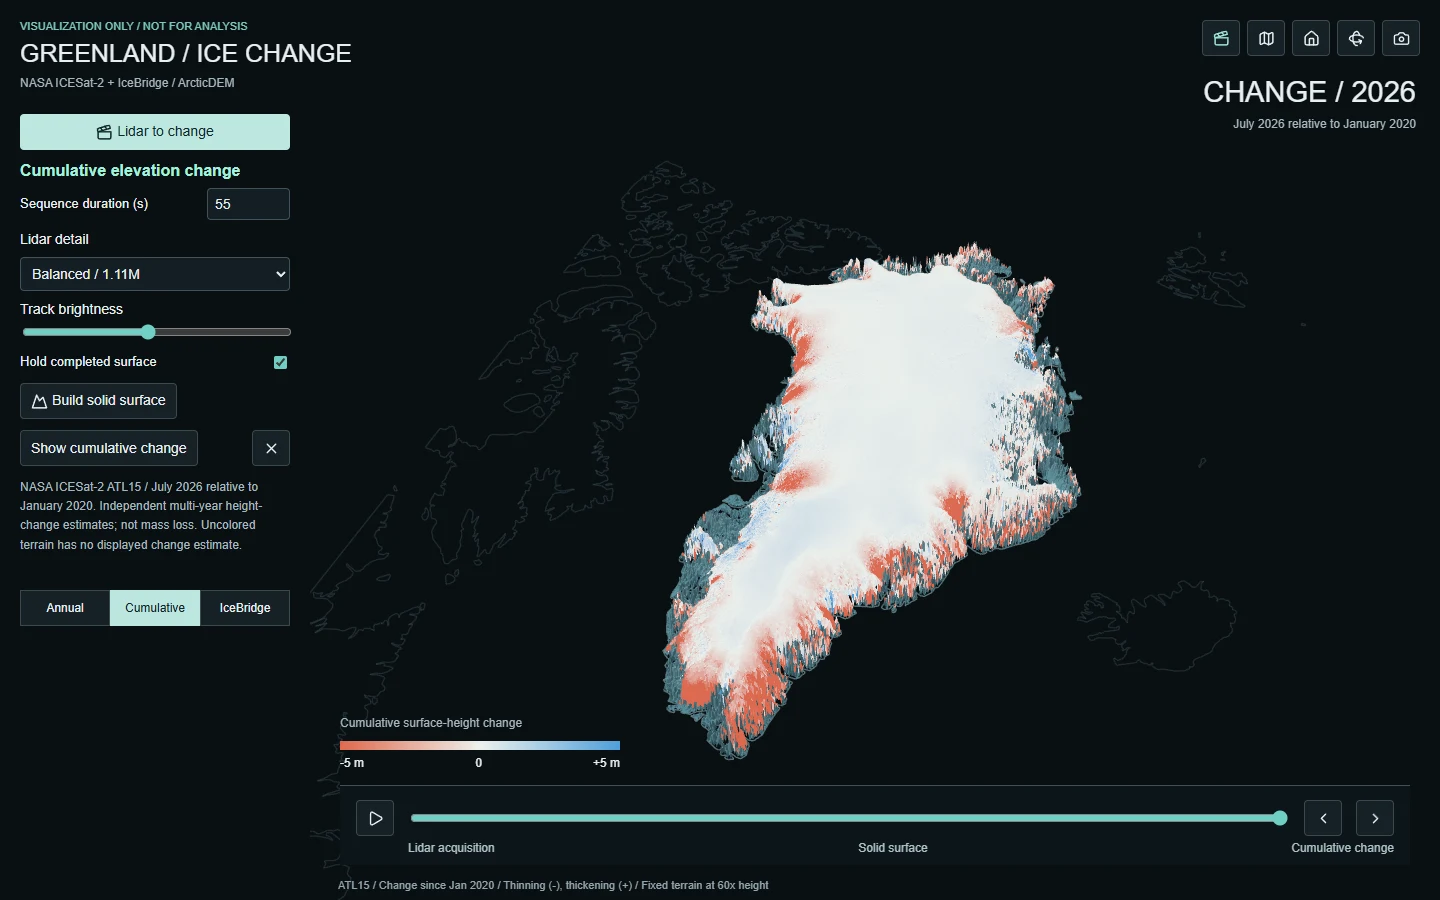
A guided 3D walkthrough moves from measured satellite lidar to a fitted and stereo-derived reference surface, then cumulative ice-surface change. Visit sampled locations near Jakobshavn, Helheim, and the Summit interior with source-linked context and cell uncertainties. Heights start at 5x exaggeration. Orbit, pan, and zoom throughout, or switch to Explore for annual change, IceBridge comparisons, and quality filters.
VISUALIZATION ONLY. This independent viewer has not been validated for scientific analysis or operational use. Heights are exaggerated, display data are sampled, and the terrain combines different observation dates. Solid terrain is not continuous direct lidar coverage. Cumulative surface-elevation change is not ice mass loss. Consult the original NASA and PGC products and their uncertainty documentation for analysis.
Greenland ice change / visualization only
Open full appTechnical Specifications
Lidar: June-August 2025 ATL06 fitted segments, with optional display detail up to 4.43 million samples. Reference terrain: ATL14 100 m and ArcticDEM 1 km overview on a 2 km display mesh; one ETOPO context fallback node. Change: ATL15 v006, July epochs through 2026, relative to January 2020; 1 km source and 5 km display sampling. Historical comparisons: IceBridge and pre-IceBridge ATM survey pairs, loaded on demand. Visualization only: mixed-date reference terrain, exaggerated heights, illustrative laser effects. Elevation change is not ice mass loss. No NASA endorsement implied.